← David Wang

CO₂ Emissions by Continent, 1750–2020

A stacked area chart of annual production-based CO₂ emissions for each continent, from the start of the Industrial Revolution to 2020.
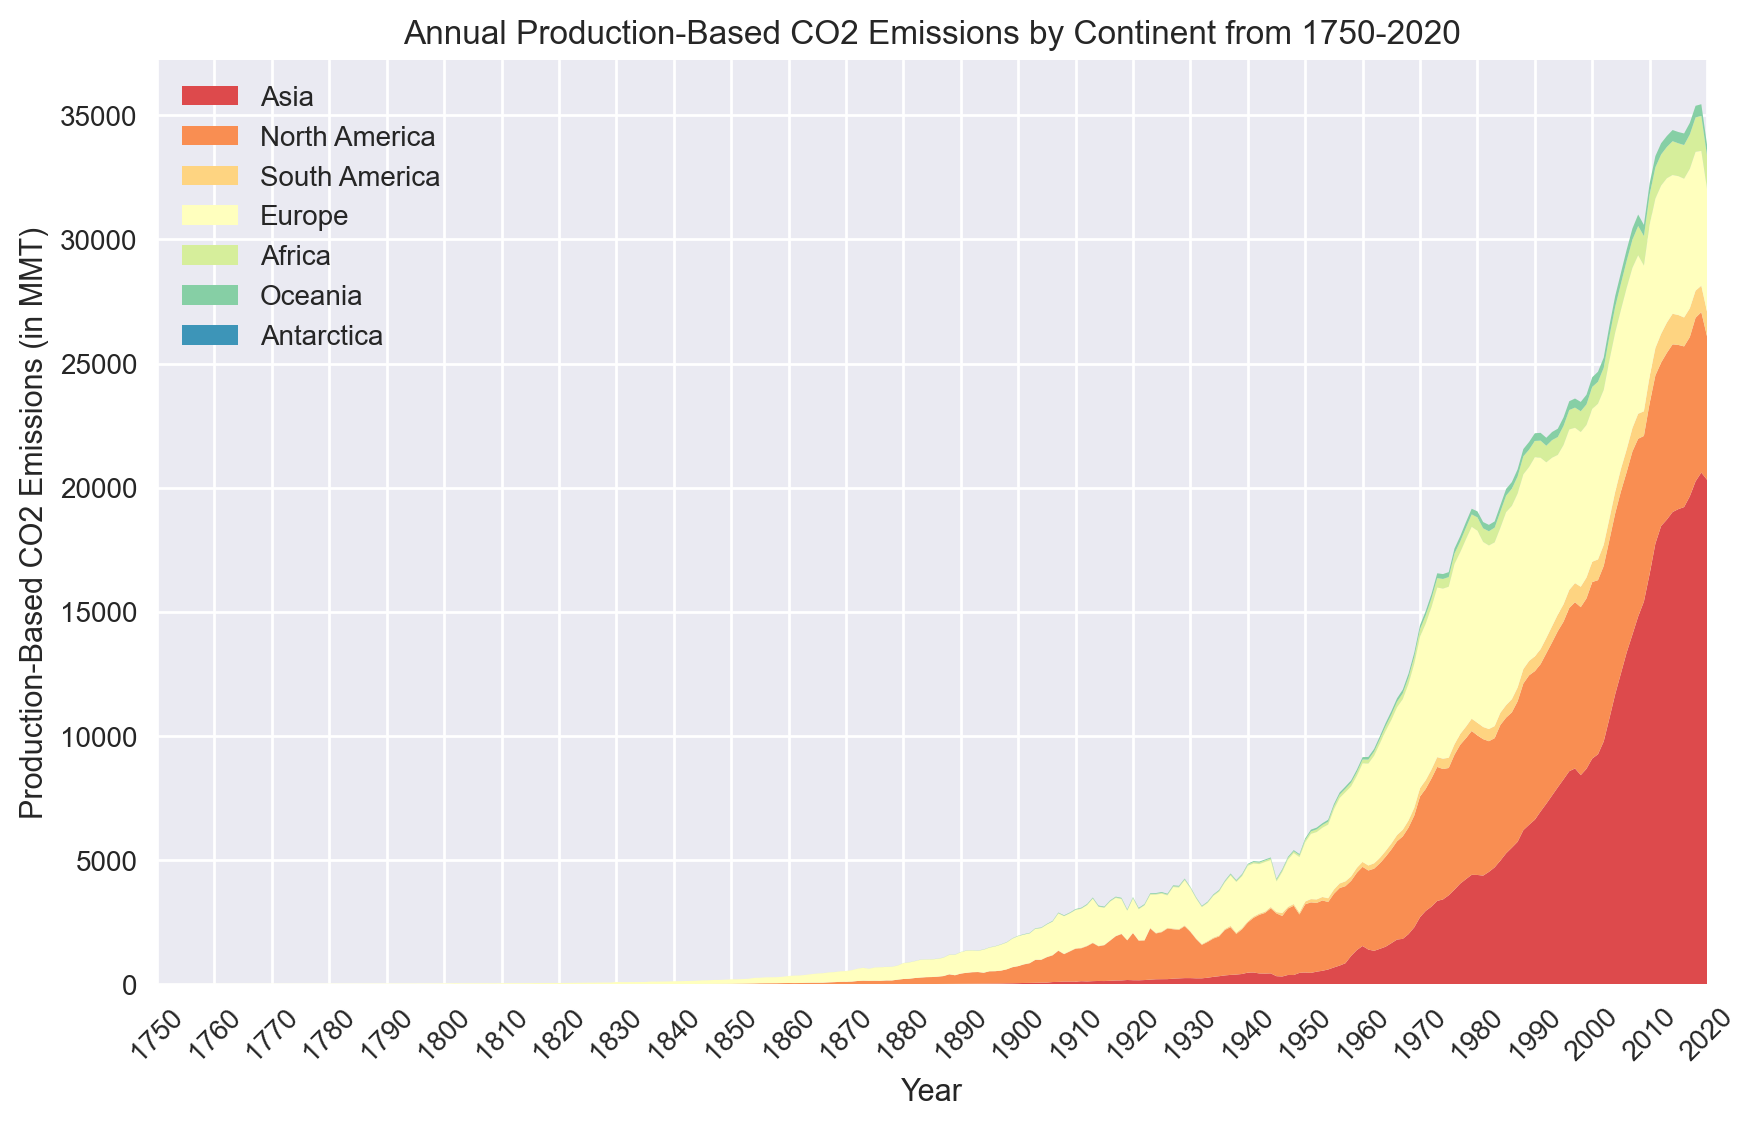
Stacked area chart of annual CO2 emissions by continent from 1750 to 2020. Emissions are near zero until the mid-1800s, then grow to about 35,000 million metric tons a year by the late 2010s. Europe and North America dominate until the late 1900s, when Asia becomes the largest emitter.
Data: Our World in Data CO₂ dataset Made with Python, pandas and matplotlib · View the code