David Wang
Things I'm building now, and data visualization work from before.
Ongoing projects
Portfolio Data visualization · 2022
Dashboard · Tableau
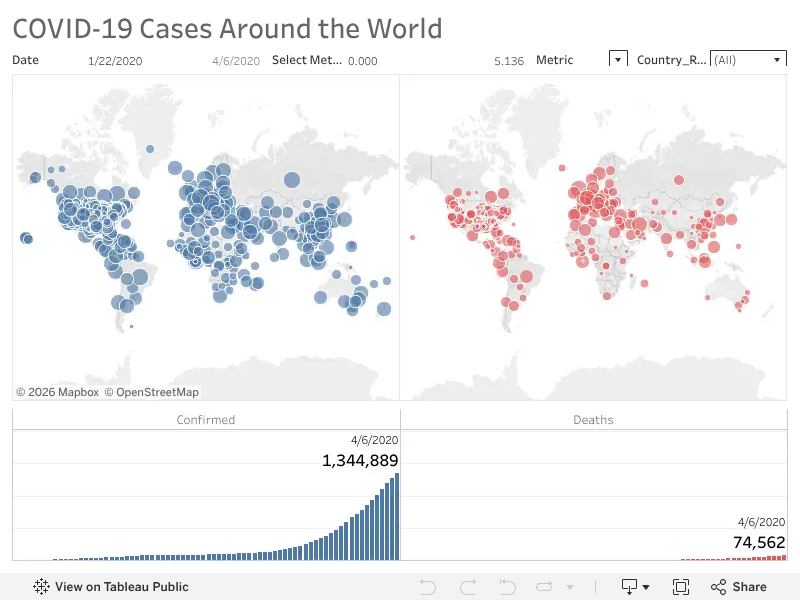
COVID-19 Dashboard
An interactive Tableau dashboard of COVID-19 data, published on Tableau Public.
Python · pandas & matplotlib
U.S. Greenhouse Gas Emissions by Sector
Emissions from transportation, electricity, industry and more, 1990–2020. Data from the EPA.
CO₂ Emissions by Continent
Annual production-based CO₂ emissions for each continent, 1750–2020.
CO₂ Emissions of the Top 10 Countries
Annual production-based CO₂ emissions of the ten largest emitters, 1750–2020.
Irvine Rainfall, 2019–2022
Total monthly rainfall in Irvine, California, one line per year.
Web charts · CodePen
Most Expensive CS:GO Skins
A sortable bar chart of the priciest weapon skins.
Median Household Income, 2018
A map shaded by median household income.
Population Pyramid of India, 2021
Male and female population by age group, back to back.
Popular NBA Players
Field goal percentage, points per game and salary for popular players in the 2020–21 season.
U.S. Summer Olympic Medals
Gold, silver and bronze medals won by the U.S. at each Summer Games from 2000 to 2016.
U.S. Inflation, 1960–1990
Annual inflation rates over three decades.
Math Quiz Scores
The spread of scores across a set of sample quizzes.
Heights and Weights
10,000 people's heights and weights, colored by gender. Hover over a dot to highlight that group.
Children's Heights and Weights
How height and weight relate in a sample of children.
Gas Prices per Gallon, 2000–2020
Yearly gas prices adjusted for inflation, built from a textbook example.
Awareness of Driverless Vehicles
How much U.S. adults say they have seen or heard about the effort to develop driverless vehicles.
What People Heard About Driverless Vehicles
Whether what people had seen or heard about driverless vehicles was mostly positive, mostly negative or a mix.