U.S. Greenhouse Gas Emissions by Economic Sector, 1990–2020
A stacked area chart of yearly U.S. greenhouse gas emissions, split into transportation, electricity, industry, agriculture, commercial, residential and U.S. territories.
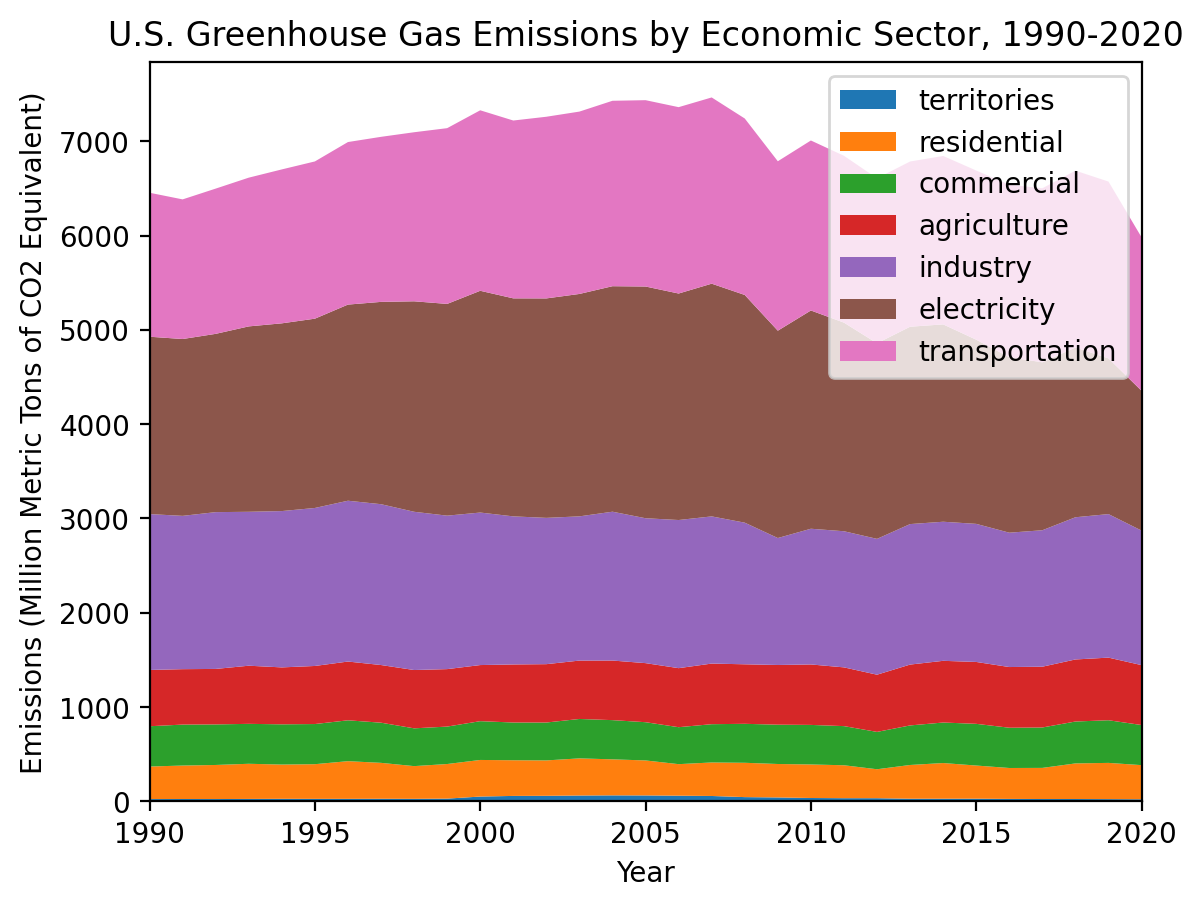
Data: U.S. EPA Greenhouse Gas Inventory
Made with Python, pandas and matplotlib · View the code